After the rally, can ZIP continue higher?

11 November 2025
Author: Sandstone Insights

Despite ZIP’s share price rising over 300%+ from the April 2025 lows, there is still plenty to get excited about. After a strong FY25 result where ZIP delivered Total Transaction Value (TTV) growth in the US of 41.6%, momentum has continued into the FY26 year, with ZIP expecting TTV growth of “greater than” 35%. In our view this could be conservative.


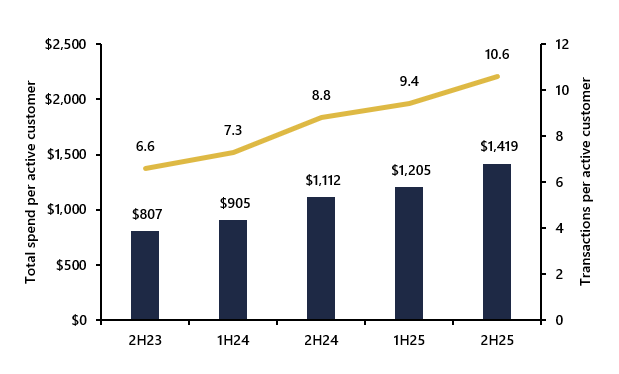
Importantly for ZIP, it has expanded the category offerings from discretionary goods, and introducing more options in non-discretionary goods such as utilities and groceries. An average active customer in FY23 was spending US$807 per year, which has now risen to US$1,419 in FY25, a 76% increase. Over the same time period, the average customer has increased transactions per year from 6.6 to 10.6. With ZIP offering payment options in more non-discretionary categories, we expect adoption from existing and new customers to accelerate into FY26.

Figure 1: ZIP’s US customers have continued to use ZIP more often and with increasingly larger spending amounts. We expect this trend to accelerate with the introduction of more payment category options, including recurring utility bills and grocery spending.

Source: Company Presentations, Sandstone Insights.

The overall BNPL industry in the US is still in its infancy, especially when compared with early geographic adopters such as Australia, Sweden and Germany. For context, Sweden currently has the highest adoption, with ~23% of all e-commerce transactions conducted with a BNPL provider, compared with the USA at just ~6%. In our view, this is the nascent ‘credit card’ opportunity seen in the 1960’s, and the BNPL industry has the opportunity to take increasing share away from incumbent banks as the younger demographics adopt BNPL providers as their main form of payment. ZIP has just under ~4% market share of the ~US$160bn opportunity as at FY25.


Figure 2: The US BNPL market is still in its infancy, representing just ~6% of all e-commerce transactions (~US$160bn). We expect this to continue growing over time as adoption increases for both online and in-store card purchases. ZIP has less than ~4% market share, accelerating the industry growth opportunity.

Source: Company Presentations, Sandstone Insights.


The key concerns from investors are around the potential for bad debts. ZIP has its own credit checking metrics, which have resulted in market leading loss rates, averaging just ~1.7% through FY25, within its target range of 1.5%-2.0%. As ZIP expands its product to allow a pay-in-8 offering, we expect bad debts will decrease. Coupled with rate cuts in the US, it is likely the US consumer is in better shape than many market participants may fear. Other concerns remain around regulation are less substantiated given the current US administration by all current accounts is encouraging looser policy, but we remain cognisant of any changes.

FY26 is shaping up for ZIP to continue to execute on its growth strategy, benefitting from significant industry tailwinds. Importantly management has evolved its partnership strategy with key payment providers such as Stripe and offerings through Google Pay, increasing merchant and user adoption alike. ZIP is also considering a Nasdaq listing, which would bring increase offshore institutional investors onto the register. We expect the BNPL space is ripe for consolidation and M&A opportunity, with ZIP both a takeover target and potential acquirer.

We expect the market is underappreciating the continued growth opportunity and accelerating customer adoption and we have conviction there is still plenty of earnings upside for ZIP. It also has an ongoing buyback which should underpin any short-term share price weakness. With improved credit quality, strong US-driven growth, and supportive macro tailwinds, ZIP’s share price momentum has a fact-based foundation to continue in FY26 and beyond.

The data on this page has been provided by an external data vendor and has not been verified by Commonwealth Securities Limited (CommSec). All recommendations, data, calculations and values have been provided for your information only and should not be relied on for financial or any other purposes. CommSec does not accept any responsibility for any losses suffered due to reliance on the data, calculations or values. Past performance is not an indicator of future performance.
 

Sandstone Insights research methodology

Sandstone Insights’ recommendations of Buy, Hold or Sell, are based on detailed qualitative and quantitative analysis of a company’s income and growth risk profile to derive an estimate of the total return an investor can expect over a 12-month period. We define total return as the share price return plus gross dividend yield and use this analysis to derive our recommendations below:

  • BUY: Expect the total return to be more than 10% in the 12-month period from the date of recommendation
  • HOLD: Expect the total return to be between +10% and -5% in the 12-month period from the date of recommendation
  • SELL: Expect the total return to be more than -5% in the 12-month period from the date of recommendation

Sandstone Insights’ quantitative model utilises historical and forecast consensus data points to determine and classify our recommendation for each security, including:

  • Forecast changes in earnings or sales over the next 12 months.
  • The company’s dividend or distribution yield forecast, grossed up for any franking credit benefit a shareholder will receive.
  • The change in the valuation multiple paid for the stock. The choice of multiple will depend on the nature of the business. We may use PE, EV/EBITDA, EV/Sales, dividend yield or price to book depending on the most suitable measure for the industry and life-stage of the company. We review the multiple and compare it to its three-year average and adjust the suitable multiple depending on our judgement about the quality of the business. Quality factors will include reputation of management, consistency of delivery, visibility of earnings drivers and the dispersion of analyst forecasts.

Sandstone Insights’ recommendations are not static and will be updated as consensus data and analyst forecasts are changed. Accordingly, the income and growth risk profiles for each stock may change over time as the data changes.
 

Key Properties definition

Sandstone Insights’ model will derive a Key Properties profile based on important factors in assessing a company’s future performance. We consider the level and sustainability of a company’s income, the level of risk and the moat position, or the defensive characteristics of the company. Each of these factors is rated on a scale and explained as follows:

Rating

  • BUY: Expect the total return to be more than 10% in the 12-month period from the date of recommendation
  • HOLD: Expect the total return to be between +10% and -5% in the 12-month period from the date of recommendation
  • SELL: Expect the total return to be more than -5% in the 12-month period from the date of recommendation


Income
1. High sustainable income. A dividend yield above the market average and expected to be sustainable over several years.

2. High income. Dividend yield above market average

3. Dividend yield in line with market average

4. Below market average dividend yield

5. No dividend, no prospect of imminent shareholder payments


Growth
1. High growth business with above average earnings growth and momentum.

2. Growth business with positive earnings growth

3. Earnings growth in line with market expectations

4. Below market earnings growth

5. Declining earnings growth


Risk
1. Low risk business with low operational, regulatory and financial risk

2. Low risk business with below average operational, regulatory or financial risk

3. Average degree of business risk

4. Above average operational, regulatory or financial risk

5. Multiple risk exposures that could be detrimental to the business

Sandstone Insights’ recommendations are of a general nature only and individuals must consider their own specific investment goals, risk tolerance, tax situation, time horizon, income needs, and complete investment portfolio, among other factors.

What are the long-term investment trends?

What are secular investing trends, and the biggest secular trends impacting sharemarkets today.

Finding your own ways to invest

Investing your hard-earned cash is as personal a decision as they come. Here’s how to find a way that could work for you.

Investing in a volatile market

It’s a well-known fact that share markets can be volatile, so investing your hard-earned money can sometimes seem a little unnerving. But have you ever considered that volatility can be a good thing?


© Commonwealth Securities Limited ABN 60 067 254 399 AFSL 238814 (CommSec) is a wholly owned but non-guaranteed subsidiary of the Commonwealth Bank of Australia ABN 48 123 123 124 AFSL 234945. CommSec is a Market Participant of ASX Limited and Cboe Australia Pty Limited, a Clearing Participant of ASX Clear Pty Limited and a Settlement Participant of ASX Settlement Pty Limited.

The information on this page has been prepared without taking into account your objectives, financial situation or needs. For this reason, any individual should, before acting on this information, consider the appropriateness of the information, having regards to their objectives, financial situation or needs, and, if necessary, seek appropriate professional advice.

CommSec does not give any representation or warranty as to the accuracy, reliability or completeness of any content on this page, including any third party sourced data, nor does it accept liability for any errors or omissions.

Top